The Webweaver's Vision
2.5 million visits walked into a web. Here is where they all went.

Project Overview
A spider knows every thread of its web. This project applies the same energy to website traffic: twelve months of user journeys and conversion funnels, mapped until every wander, hesitation, and rage-quit had an explanation.
Tracking behavior across every touchpoint surfaced the unglamorous truths that actually move revenue: which pages perform, which pages hemorrhage visitors, and precisely where the conversion funnel springs its leaks.
The result is a punch list, not a poem: concrete UX fixes, content moves, and marketing adjustments, each backed by numbers instead of vibes.
Project Details
Google Analytics, SQL, Looker
Multi-site Analytics
12 months
2.5M+ visits
Key Insights
User Journeys
Mapped 15 distinct user paths. Only 3 actually lead to conversion; the other 12 are scenic routes.
Bounce Reduction
Found pages bouncing 65% of visitors like a strict doorman. Fixes cut it to 32%.
Load Performance
Pages loading under 2 seconds converted 45% better. Patience is not a web strategy.
Mobile Traffic
68% of traffic is mobile, converting at just 42% of desktop—a thumb-sized gap worth real money.
Visualizations
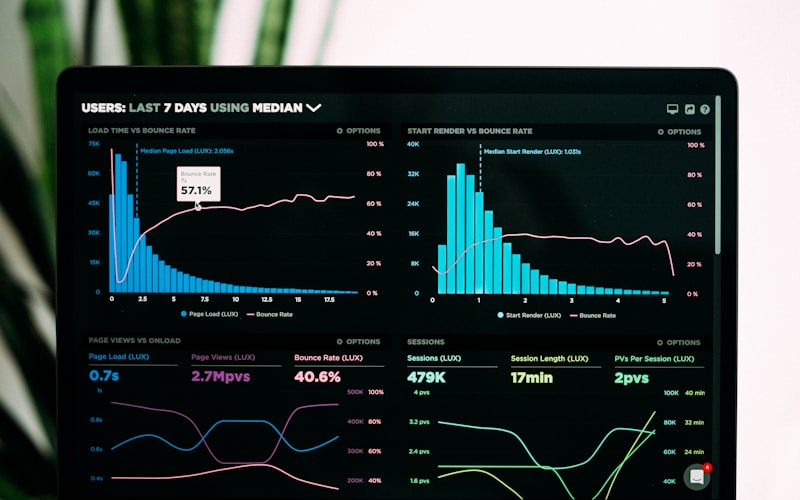

Your website is keeping secrets
Let’s read its diary—the analytics—and find out where the growth is hiding.
Start a Project